In this article we assume that you are familiar with Salt, formulas, reclass and OpenStack-Salt. This is my cheatsheet which drives you step by step to deploy OpenStack Mitaka based on the latest model, using a new Cluster Class. If you feel lost, feel free to get back to the beginning.
What’s new
The mk-lab-salt model, built for training and development, introduce the following new features
- Salt Master now runs on Ubuntu 16.04 LTS
- OpenStack packages comes from Mirantis repositories
- New top level cluster class allows a simple modeling of multiple deployments in a single reclass model.
- Mirantis Stacklight, logging, monitoring and alerting tooling is now integrated
Modeling your Infrastructure
In this session, I’ll be using my forked repository of Mirantis mk-lab-salt-model infrastructure modeling.
Fork and Clone upstream Mirantis model
Fork the Mirantis repository, Log into your GitHub account, accessing the Mirantis repository and click on fork.
Once its done, you can clone your fork
# git clone git@github.com:planetrobbie/mk-lab-salt-model.git /srv/salt/reclass -b master
Enter passphrase for key '/root/.ssh/id_rsa':
remote: Counting objects: 1528, done.
remote: Total 1528 (delta 0), reused 0 (delta 0), pack-reused 1528
Receiving objects: 100% (1528/1528), 162.76 KiB | 210.00 KiB/s, done.
Resolving deltas: 100% (704/704), done.
Checking connectivity... done.
Note: avoid HTTPS while cloning, prefer SSH, it will enable you to push your updates just using your SSH key instead of typing your password at each push to origin !
Tweak your model to your need
First of all, each of your minion should have an ID which correspond to nodes described in the reclass model. Currently the nodes should have the following ID:
- ctl01.mk22-lab-advanced.local
- ctl02.mk22-lab-advanced.local
- ctl03.mk22-lab-advanced.local
- cmp01.mk22-lab-advanced.local
- mon01.mk22-lab-advanced.local
- prx01.mk22-lab-advanced.local
We’ve introduced the concept of cluster class to give you an easy way to describe multiple deployment in the same model.
Each deployment is now defined in its own cluster directory classes/cluster/<deployment_name>. Our current model offers the following ones:
- mk20_lab_basic
- mk20_lab_advanced
- mk20_lab_expert
- mk20_stacklight_basic
- mk20_stacklight_advanced
- mk22_lab_basic
- mk22_lab_advanced
- mk22_scale_mirantis
- mk22_full_scale
Let’s review the mk22_lab_advanced cluster class, which describe the following nodes
- 1 config node - Salt Master Node
- 3 control nodes - OpenStack/OpenContrail control plane
- 1 compute node - KVM node
- 3 monitor node - StackLight backend.
- 1 Proxy Node - frontend to web UI
the Cluster classe structure of our mk22_lab_advanced looks like this
├── fuel
|   ├── config.yml
│   └── init.yml
├── init.yml
├── openstack
│   ├── compute.yml
│   ├── control.yml
│   ├── dashboard.yml
│   ├── init.yml
│   └── proxy.yml
└── stacklight
    ├── client.yml
    ├── init.yml
    ├── proxy.yml
    └── server.yml
| path | details |
|---|---|
fuel/config.yml |
Salt Master parameters: git repository, git branch, IPs, interfaces, Galera nodes declaration |
| fuel/init.yml | Declaration of cfg01 host |
| init.yml | cluster domain, compute node declaration, IPs |
| openstack/init.yml | OpenStack and OpenContrail version, passwords, Controllers IPs, VIP, nodes declaration |
| openstack/compute.yml | compute nodes params: OpenContrail GW, Data plane interface (vhost0) |
| openstack/control.yml | Keepalived interface |
| openstack/dashboard.yml | repository |
| openstack/proxy.yml | declaration for nginx ssl endpoint to proxy access to API and UI |
| stacklight/init.yml | passwords, monitoring node declaration |
| stacklight/client.yml | classes for collectd, heka, sensu nodes |
| stacklight/proxy.yml | declaration for nginx ssl endpoint to proxy access to Kibana and Grafana |
| stacklight/server.yml | Kibana host |
Apart from the cluster class you can look at the following files
| path | details |
|---|---|
| classes/system/openssh/server/single.yml | declare additional users with their SSH keys |
| nodes/control/cfg01.mk22-lab-advanced.local.yml | model repository branch and can overload Timezone |
Tweak all the necessary bold parameters, depending on your infrastructure requirements above.
Check if it looks good
Following up your model adaptation above, check that everything looks good
# reclass-salt --top
Verify that your minions are responding and are running the same version as your Salt Master
# salt '*' test.version
Note: As of today, december 2017, it should be 2016.3.3 (Boron).
If versions aren’t in sync, refer to the official installation guide or just reinstall salt-minion from the official SaltStack repository on the target nodes as follow:
# echo "deb http://repo.saltstack.com/apt/ubuntu/14.04/amd64/2016.3 trusty main" > /etc/apt/sources.list.d/saltstack.list
# wget -O - https://repo.saltstack.com/apt/ubuntu/14.04/amd64/2016.3/SALTSTACK-GPG-KEY.pub | apt-key add -
# apt-get clean
# apt-get update
# apt-get install -y salt-minion
Commit your changes
Before you can apply the model to any nodes, you need to commit the changes to your repository
# cd /srv/salt/reclass
# git add -A .
# git commit -m "model updated to lab requirements"
# git push origin
Run the reclass.storage state to generate all the nodes within /srv/salt/reclass/nodes/_generated
salt 'cfg01*' state.sls salt.master,reclass
Refresh minion’s pillar data
# salt '*' saltutil.refresh_pillar
ctl03.mk22-lab-advanced.local:
    True
ctl01.mk22-lab-advanced.local:
    True
ctl02.mk22-lab-advanced.local:
    True
cfg01.mk22-lab-advanced.local:
    True
Sync all Salt resources
# salt '*' saltutil.sync_all
Salt Master
To install your Salt Master, follow the instructions given in our our previous article, the only changed step is the one above where I use another model instead of the workshop-salt-model, I’m copying for reference the command below
git clone git@github.com:planetrobbie/mk-lab-salt-model.git /srv/salt/reclass -b master
Formulas
In this development lab, we will be cloning formulas from their respective source repo using a script that you can find in my repository.
Salt Master provisioning cheatsheet
To provision your Salt Master run
salt "cfg01*" state.sls salt.master
salt "cfg01*" state.sls linux,openssh,salt.minion,ntp
Everything should be green, re-run it if that’s not the case.
Deploy Common environment and Support Services
Controllers > linux | openssh | salt.minion | ntp
Let’s run the first batch of states
salt "ctl*" state.sls linux,openssh,salt.minion,ntp
Controllers > keepalived
Provision keepalived, a daemon for cluster VIP based on VRRP, here we are using a Compound matcher](https://docs.saltstack.com/en/latest/topics/targeting/compound.html) which glob on Pillar Data and will then be applied on all corresponding node.
# salt -C 'I@keepalived:cluster' state.sls keepalived -b 1
-b 1 define a batch size of 1, instead of executing on all targeted minions at once, execute on a progressive set of minions.
Check Keepalived
# salt -C 'I@keepalived:cluster' cmd.run "ip a | grep '\/32'"

ctl03.mk22-lab-advanced.local:
        inet 172.16.10.254/32 scope global eth0
As you can see above, our 172.16.10.254 VIP is now present on ctl03.
Controllers > Gluster
Setup Gluster Service
# salt -C 'I@glusterfs:server' state.sls glusterfs.server.service
Now Prepare the Glusterfs volumes
# salt -C 'I@glusterfs:server' state.sls glusterfs.server.setup -b 1
Check Gluster
# salt -C 'I@glusterfs:server' cmd.run "gluster peer status; gluster volume status" -b 1
If anything goes wrong, start over by deleting the affected volumes, re-create it manually and start it.
ctl01# gluster delete volume glance
ctl01# gluster volume create keystone-keys replica 3 172.16.10.101:/srv/glusterfs/keystone-keys 172.16.10.102:/srv/glusterfs/keystone-keys 172.16.10.103:/srv/glusterfs/keystone-keys force
ctl01# gluster volume start glance force
# salt-call state.sls glusterfs.server.setup
Controllers > RabbitMQ
Let’s now install and configure RabbitMQ on our cluster
# salt -C 'I@rabbitmq:server' state.sls rabbitmq
Check RabbitMQ
# salt -C 'I@rabbitmq:server' cmd.run "rabbitmqctl cluster_status"
Controllers > MySQL Galera
Let’s now deploy our database cluster, starting by the master
# salt -C 'I@galera:master' state.sls galera
Once the previous command terminate, deploy the remaining Galera nodes
# salt -C 'I@galera:slave' state.sls galera
Galera state also creates the database tables and users for OpenStack services.
Note: After the first failed run on the slaves, I had to apply the following patches on the Galera formula
--- a/galera/files/init_bootstrap.sh
+++ b/galera/files/init_bootstrap.sh
@@ -6,7 +6,7 @@ counter=60

 while [ $counter -gt 0 ]
 do
-  mysql -u root -e"quit"
+  mysql -u root -e"quit" -pworkshop
   if [[ $? -eq 0 ]]; then
     exit 0
   fi
diff --git a/galera/slave.sls b/galera/slave.sls
index 5a58186..d813370 100644
--- a/galera/slave.sls
+++ b/galera/slave.sls
@@ -91,7 +91,8 @@ galera_init_start_service:

 galera_bootstrap_set_root_password:
   cmd.run:
-  - name: mysqladmin password "{{ slave.admin.password }}"
+  - name: echo "patched - can't set root password two times"
+#  - name: mysqladmin password "{{ slave.admin.password }}"
   - require:
     - cmd: galera_init_start_service
Check Galera
# salt -C 'I@galera:master' mysql.status | grep -A1 wsrep_cluster_size
# salt -C 'I@galera:slave' mysql.status | grep -A1 wsrep_cluster_size
Controllers > HAProxy
# salt -C 'I@haproxy:proxy' state.sls haproxy
Check HAProxy
# salt -C 'I@haproxy:proxy' service.status haproxy
Now restart rsyslog
# salt -I 'haproxy:proxy' service.restart rsyslog
Controllers > memcached
# salt -C 'I@memcached:server' state.sls memcached
OpenStack Control Services
Controllers > Keystone | Glance
Provision Keystone
# salt -C 'I@keystone:server' state.sls keystone.server -b 1
Populate keystone services/tenants/admins
# salt -C 'I@keystone:client' state.sls keystone.client
Check Keystone
# salt -C 'I@keystone:server' cmd.run ". /root/keystonerc; keystone service-list"
Continue on with Glance State
# salt -C 'I@glance:server' state.sls glance -b 1
Run the Glusterfs client state
# salt -C 'I@glance:server' state.sls glusterfs.client
Re-run Keystone state to re-create the fernet tokens within the Gluster mounted filesystem
# salt -C 'I@keystone:server' state.sls keystone.server
Check Glance
# salt -C 'I@keystone:server' cmd.run ". /root/keystonerc; glance image-list"
Controllers > Nova
Install Nova, in this deployment we will use the LVM backend for Cinder
# salt -C 'I@nova:controller' state.sls nova -b 1
Check Nova
# salt -C 'I@keystone:server' cmd.run ". /root/keystonerc; nova service-list"
Controllers > Cinder
# salt -C 'I@cinder:controller' state.sls cinder -b 1
Check Cinder
# salt -C 'I@keystone:server' cmd.run ". /root/keystonerc; cinder list"
Controllers > Neutron
# salt -C 'I@neutron:server' state.sls neutron -b 1
Check Neutron
# salt -C 'I@keystone:server' cmd.run ". /root/keystonerc; neutron agent-list"
Getting errors here is totally normal, OpenContrail is not yet there !
Controller > Heat
# salt -C 'I@heat:server' state.sls heat -b 1
Check Heat
# salt -C 'I@keystone:server' cmd.run ". /root/keystonerc; heat resource-type-list"
Horizon | Nginx
For Horizon deployment you need to bring your prx01 proxy node to the baseline
salt "prx01*" state.sls linux,openssh,salt.minion,ntp
You can then deploy Horizon and Ninx
# salt -C 'I@horizon:server' state.sls horizon
Note: This model use a custom theme stored on prx01 at /usr/share/openstack-dashboard-mirantis-theme/static/mirantis
In this lab we aill be using our Salt Master as our reverse proxy to access our Web UI, so deploy Nginx on it.
# salt -C 'I@nginx:server' state.sls nginx
Check Horizon
Horizon should be available on http://172.16.10.121:8078, default login/password is admin/workshop, but before you can really use it you have to terminate the deployment.
OpenContrail
Install opencontrail database services
# salt -C 'I@opencontrail:database' state.sls opencontrail.database -b 1
Install opencontrail control services
# salt -C 'I@opencontrail:control' state.sls opencontrail -b 1
Contrail Post installation
Provision opencontrail control services
# salt -C 'I@opencontrail:control:id:1' cmd.run "/usr/share/contrail-utils/provision_control.py --api_server_ip 172.16.10.254 --api_server_port 8082 --host_name ctl01 --host_ip 172.16.10.101 --router_asn 64512 --admin_password workshop --admin_user admin --admin_tenant_name admin --oper add"

# salt -C 'I@opencontrail:control:id:1' cmd.run "/usr/share/contrail-utils/provision_control.py --api_server_ip 172.16.10.254 --api_server_port 8082 --host_name ctl02 --host_ip 172.16.10.102 --router_asn 64512 --admin_password workshop --admin_user admin --admin_tenant_name admin --oper add"

# salt -C 'I@opencontrail:control:id:1' cmd.run "/usr/share/contrail-utils/provision_control.py --api_server_ip 172.16.10.254 --api_server_port 8082 --host_name ctl03 --host_ip 172.16.10.103 --router_asn 64512 --admin_password workshop --admin_user admin --admin_tenant_name admin --oper add"
Check Contrail
# salt -C 'I@opencontrail:control' cmd.run "contrail-status"
# salt -C 'I@keystone:server' cmd.run ". /root/keystonerc; neutron net-list; nova net-list"
Access OpenContrail Web UI at https://172.16.10.254:8143/ using admin/workshop login/password.
You should be able to create networks, subnets, routers, consult OpenStack documentation for the corresponding workflow.
StackLight
StackLight is Mirantis solution to monitor your private cloud. Let’s bring your monitoring nodes to the baseline. This model deploy StackLight on three Ubuntu 16.04 nodes in High Availability mode.
# salt "mon*" state.sls linux,openssh,salt.minion,ntp
Now to deploy the monitoring backends, StackLight on this node, run the following states:
# salt -C 'I@elasticsearch:server' state.sls elasticsearch.server -b 1
# salt -C 'I@influxdb:server' state.sls influxdb -b 1
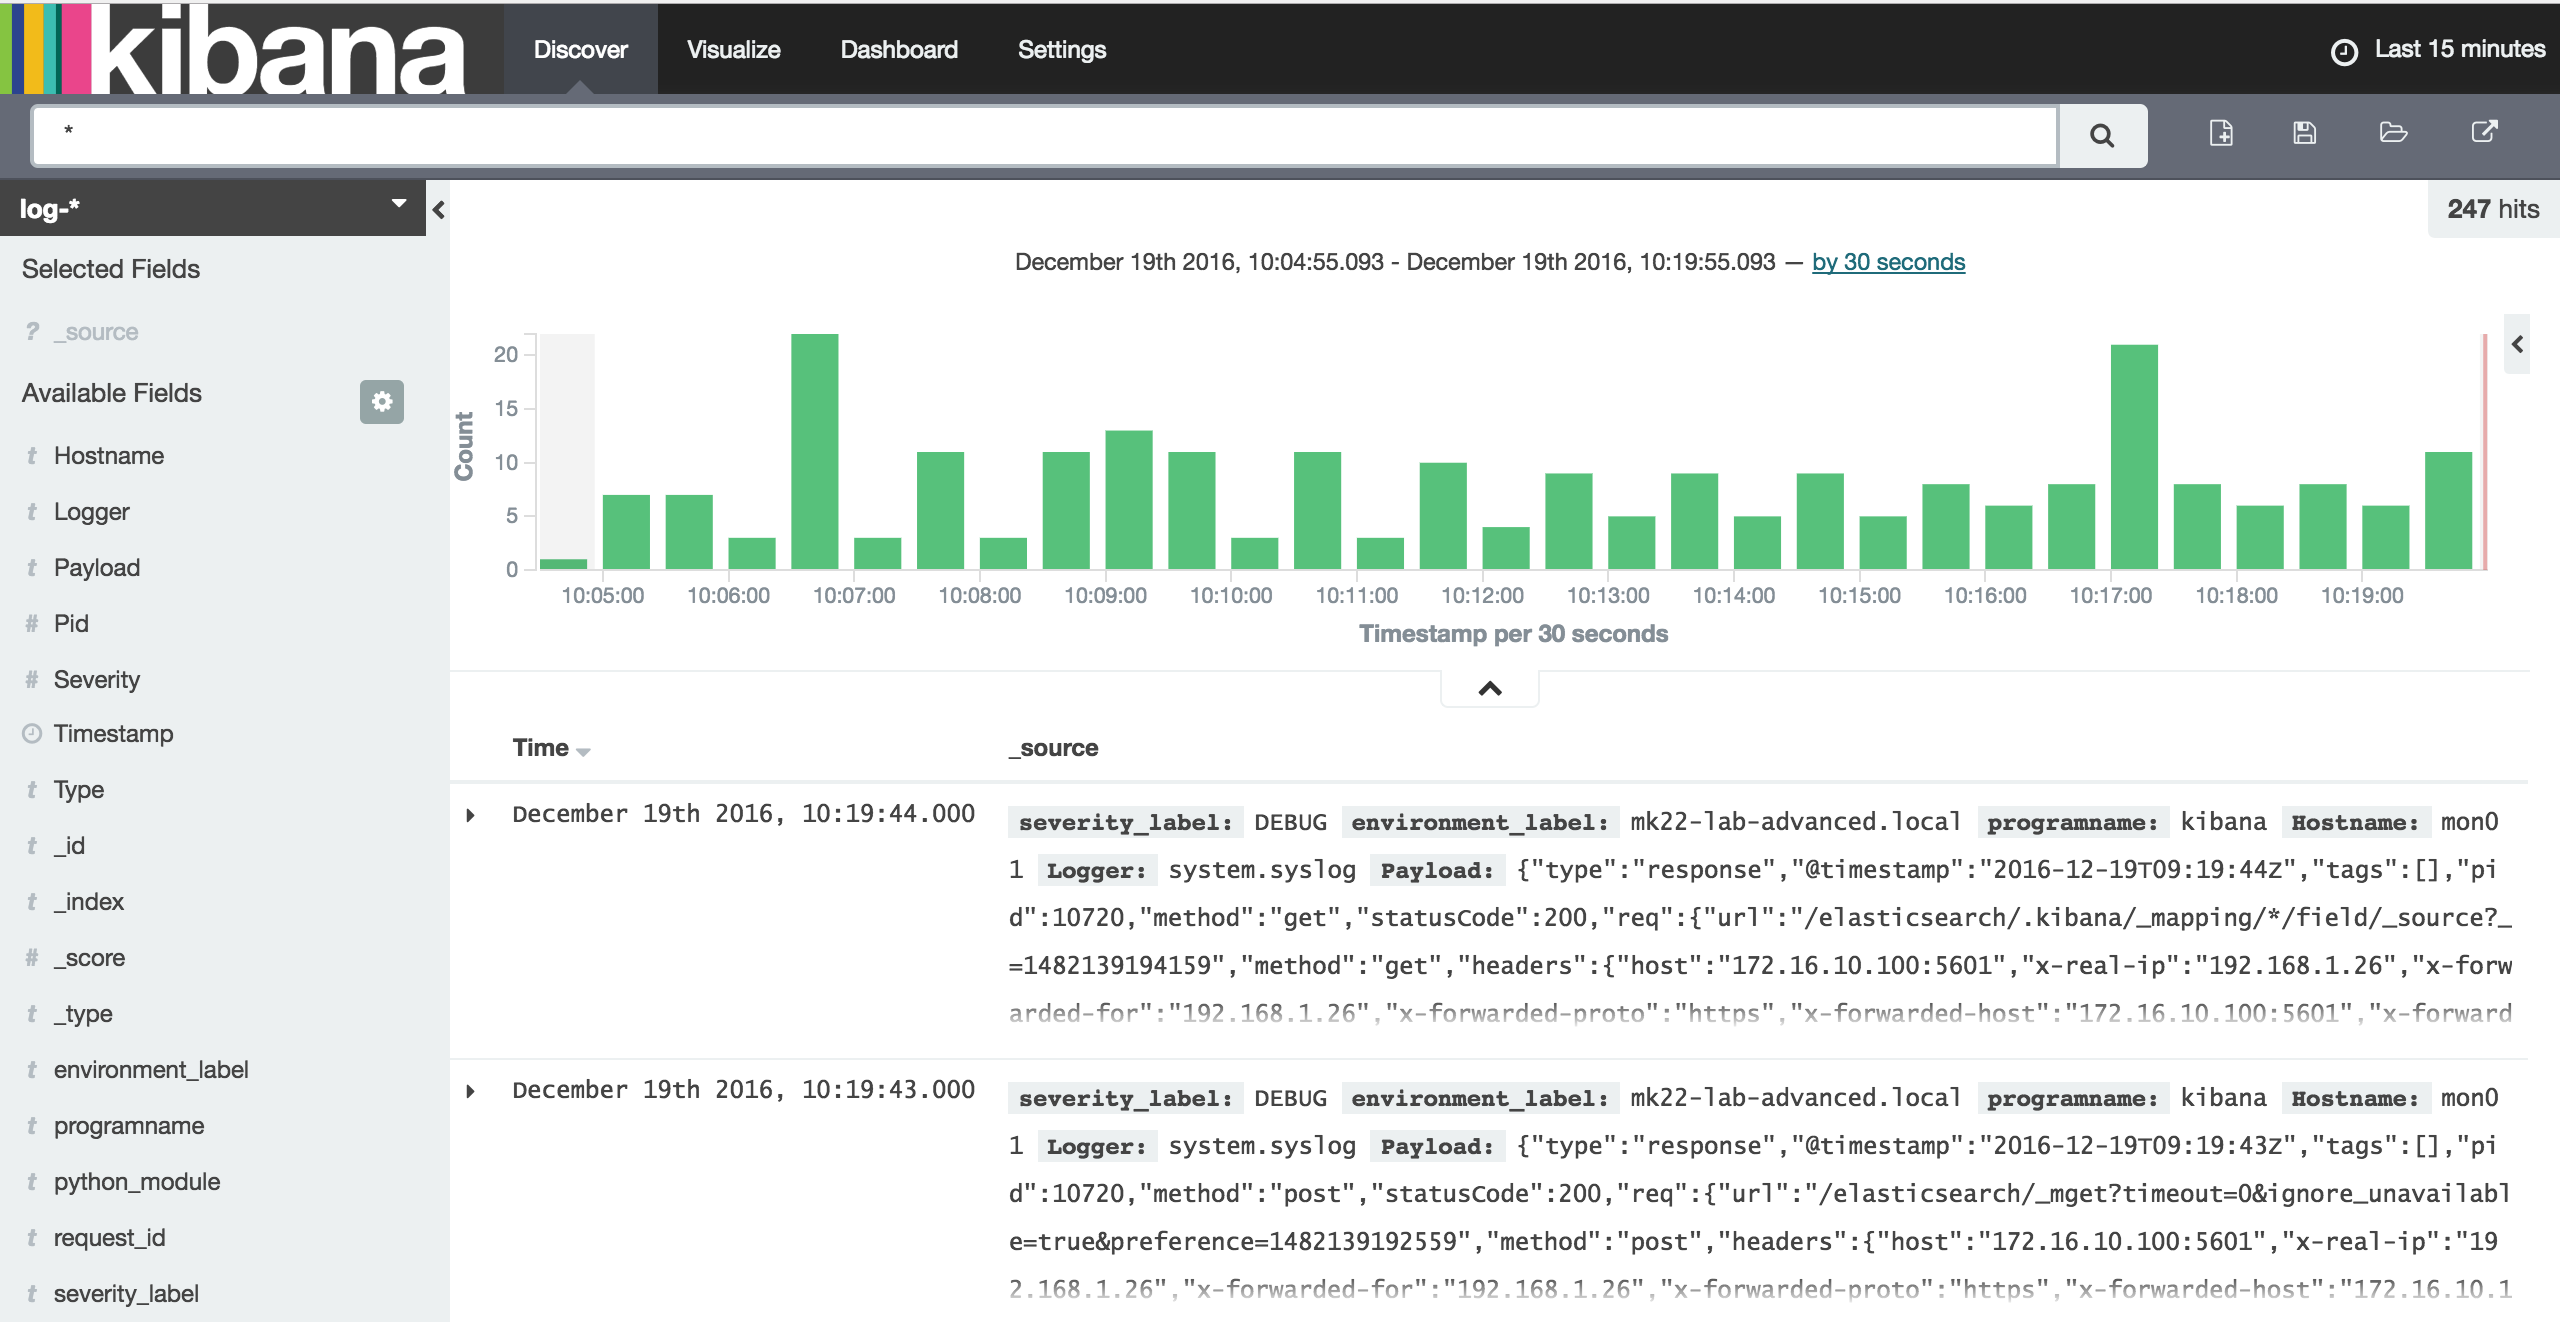
# salt -C 'I@kibana:server' state.sls kibana.server -b 1
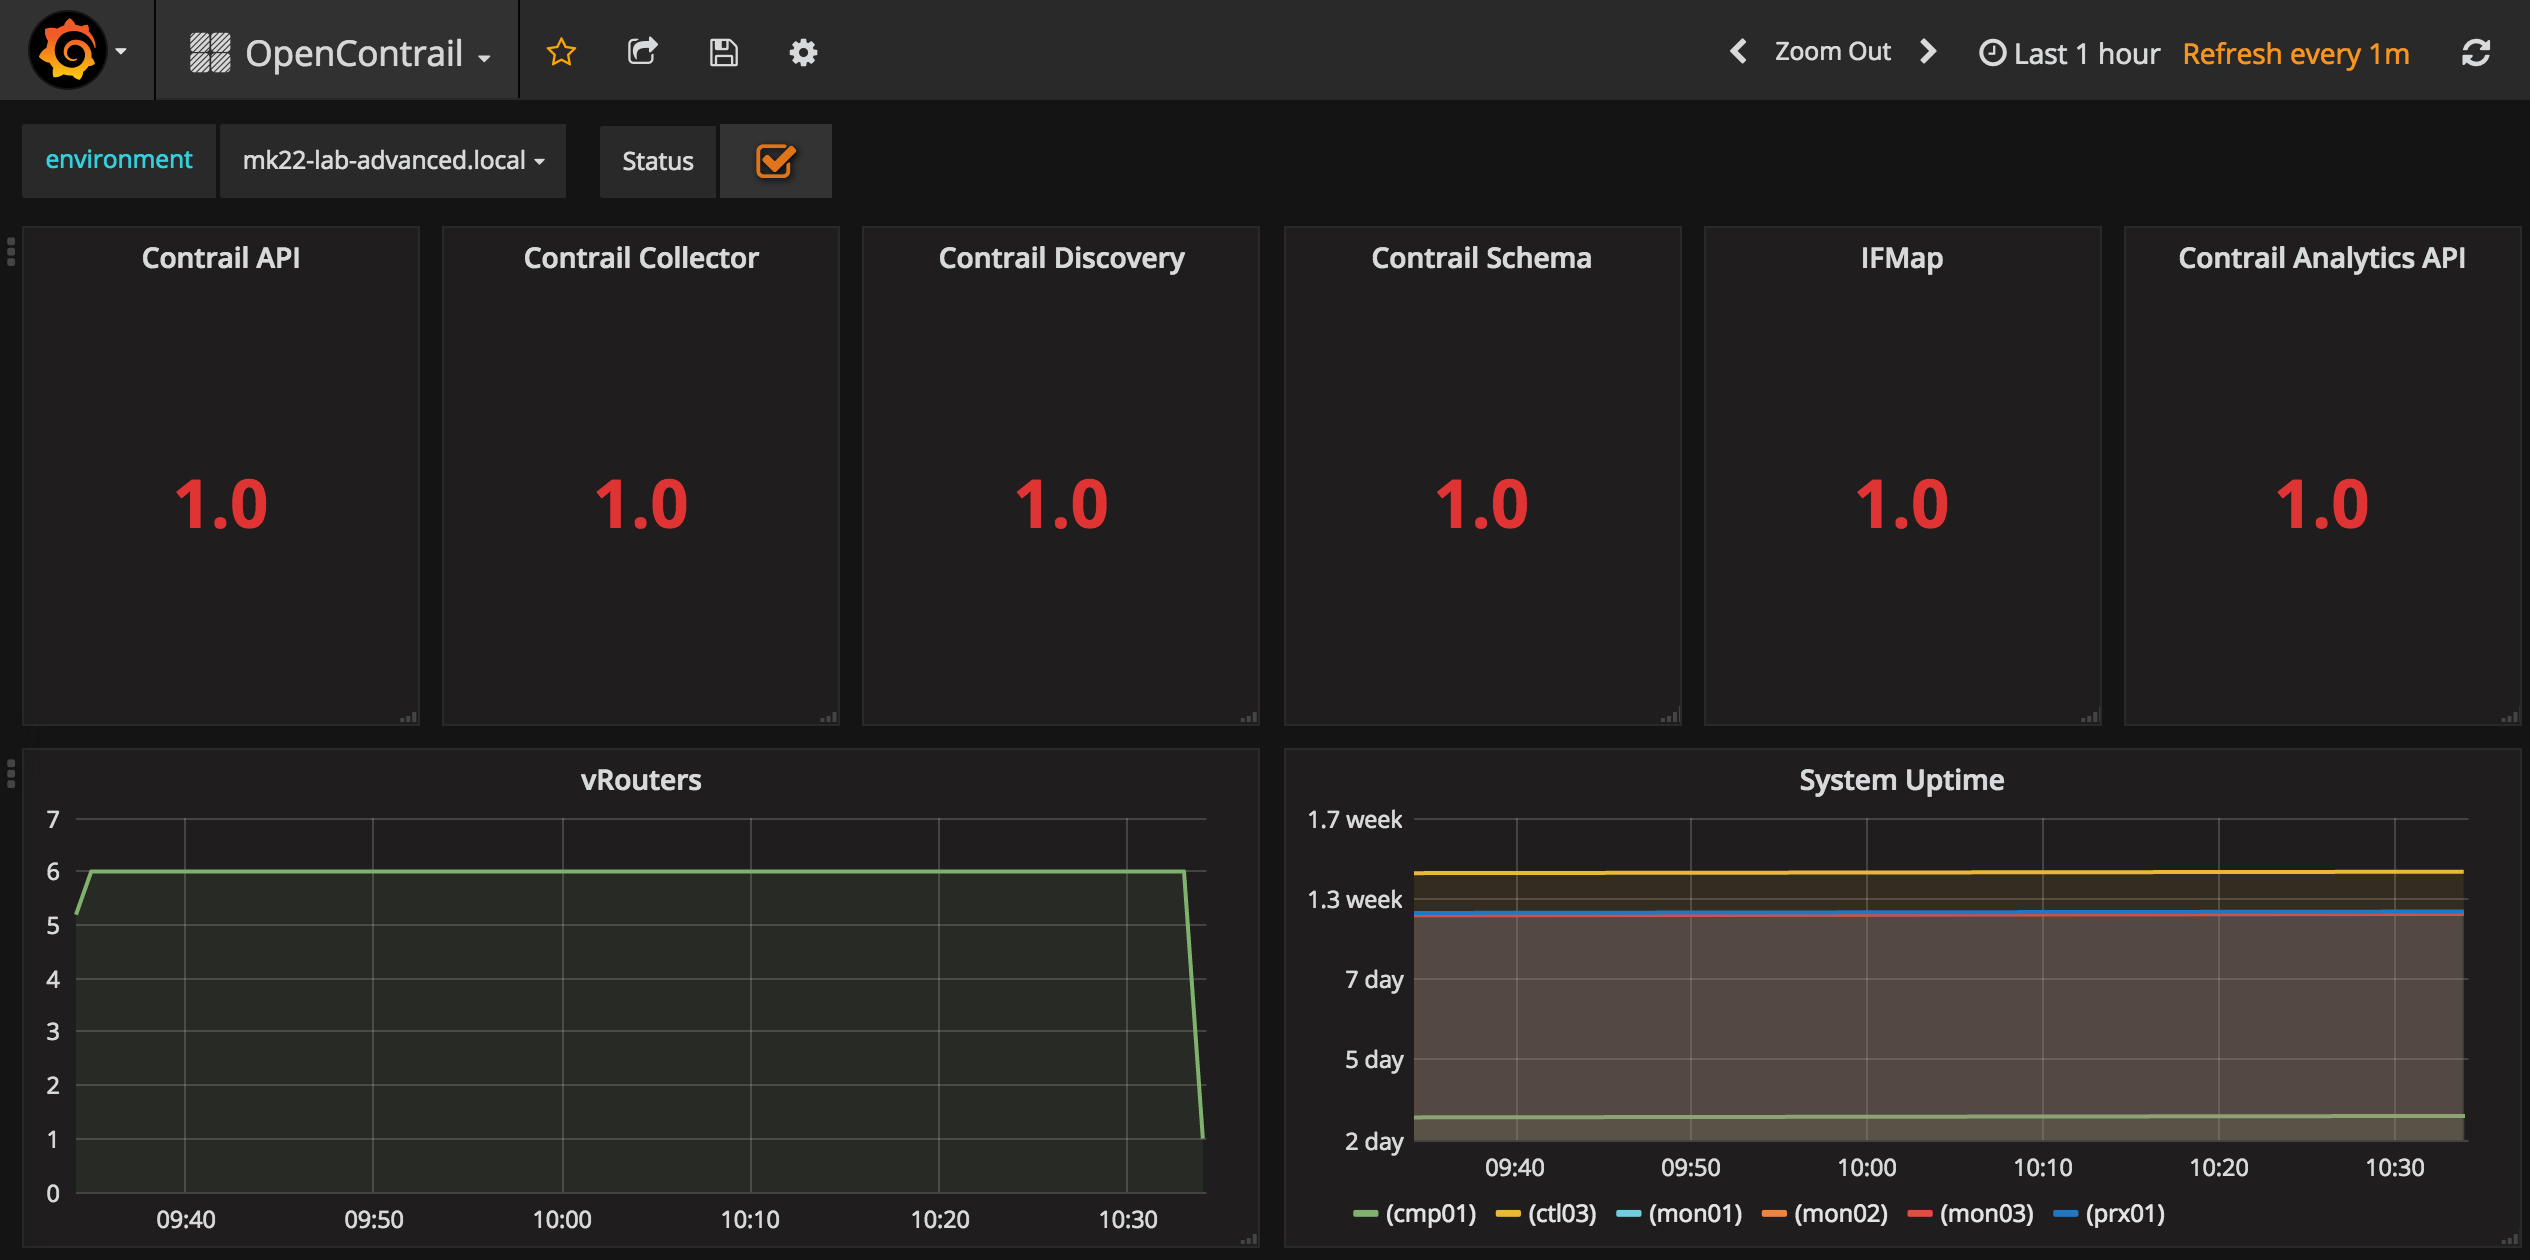
# salt -C 'I@grafana:server' state.sls grafana.server -b 1
# salt -C 'I@nagios:server' state.sls nagios -b 1
# salt -C 'I@elasticsearch:client' state.sls elasticsearch.client.service
# salt -C 'I@kibana:client' state.sls kibana.client.service
# salt -C 'I@kibana:client or I@elasticsearch:client' --async service.restart salt-minion
Wait and continue with
# salt -C 'I@elasticsearch:client' state.sls elasticsearch.client
# salt -C 'I@kibana:client' state.sls kibana.client
If the command above fails when trying to bind to the StackLight VIP (172.16.10.253), check on which interface the VIP is configured in the following file:
# vi /srv/salt/reclass/classes/cluster/mk22_lab_advanced/stacklight/server.yml
And run the following state to update the VIP.
# salt -C 'I@keepalived:cluster' state.sls keepalived -b 1
If it still fails trying to connect also run the following state
# salt -C 'I@haproxy:proxy' state.sls haproxy
Now connect to the Web UI at
- Kibana / https://172.16.10.100:5601 or http://172.16.10.253:5601/
- Grafana / https://172.16.10.100:8084/login or http://172.16.10.253:3000/login l: admin p: password
- Nagios / https://172.16.10.100:8001 or http://172.16.10.253 l: nagiosadmin p:nagios
All of the above should be mostly empty, it’s normal, we aren’t yet done.
In case of issues while trying to connect to them run
# salt -C 'I@nginx:server' state.sls nginx
Compute node
To provision your compute nodes run
# salt 'cmp*' state.apply
# salt 'cmp*' state.apply
Note: I had to patch the heka formula by replacing
swap_size: {{ salt['ps.swap_memory']()['total'] }}
by
swap_size: 8192
In our workshop lab, we have a single NIC card, so Salt state cannot be used to configure the network or it will cut out the connection, so for production deployment we are saying that is is much better to have at least two network card, one for dataplane and one for management, ideally a bond of two for production traffic and a 1G interface for out of band management (PXE and Salt)
In our case you can configure compute node networking as shown below
cmp01# vi /etc/network/interfaces
auto lo
iface lo inet loopback

auto eth0
iface eth0 inet manual
pre-up ifconfig eth0 up
post-down ifconfig eth0 down

auto vhost0
iface vhost0 inet static
    pre-up /usr/lib/contrail/if-vhost0
    address 172.16.10.105
    network_name application
    netmask 255.255.255.0
    gateway 172.16.10.1
    dns-nameservers <YOUR DNS SERVER>
Now Reboot your compute node
salt "cmp*" system.reboot
Check that your IP should be bound to vhost0, which is required for Contrail . Also check contrail status
cmp01# contrail-status
<snip>
Register your vRouter run
# salt -C 'I@opencontrail:control:id:1' cmd.run "/usr/share/contrail-utils/provision_vrouter.py --host_name cmp01 --host_ip 172.16.10.105 --api_server_ip 172.16.10.254 --oper add --admin_user admin --admin_password workshop --admin_tenant_name admin"
You can process the same way to deploy your second compute node.
Check Compute node
From one of your controller, check if your compute node is present
root@ctl01:~# source /root/keystonerc
root@ctl01:~# nova hypervisor-list
+----+-------------------------------+-------+---------+
| ID | Hypervisor hostname           | State | Status  |
+----+-------------------------------+-------+---------+
| 3  | cmp01.mk22-lab-advanced.local | up    | enabled |
+----+-------------------------------+-------+---------+
Monitoring
Lets finish our deployment by deploying the remaining monitoring components.
Start by flusing Salt Mine to make sure it is clean, Mine are data about your minions available from the master for minion to consume.
# salt "*" mine.flush
Install StackLight services, and gather the Collectd and Heka metadata
# salt "*" state.sls collectd
# salt "*" state.sls heka
Gather the Grafana metadata as grains
# salt -C 'I@grafana:collector' state.sls grafana.collector
Update Salt Mine
# salt "*" state.sls salt.minion.grains
# salt "*" saltutil.refresh_modules
# salt "*" mine.update
Update Heka
# salt -C 'I@heka:aggregator:enabled:True or I@heka:remote_collector:enabled:True' state.sls heka
Update Collectd
# salt -C 'I@collectd:remote_client:enabled:True' state.sls collectd
Update Nagios
# salt -C 'I@nagios:server' state.sls nagios
Finalize the configuration of Grafana (add the dashboards…)
# salt -C 'I@grafana:client' state.sls grafana.client.service
# salt -C 'I@grafana:client' --async service.restart salt-minion; sleep 10
# salt -C 'I@grafana:client' state.sls grafana.client
Get the StackLight VIP
# vip=$(salt-call pillar.data _param:stacklight_monitor_address --out key|grep _param: |awk '{print $2}')
# vip=${vip:=172.16.10.253}
Start manually the services that are bound to the monitoring VIP
# salt -G "ipv4:$vip" service.start remote_collectd
# salt -G "ipv4:$vip" service.start remote_collector
# salt -G "ipv4:$vip" service.start aggregator
Stop Nagios on monitoring nodes (b/c package starts it by default)
# salt -C 'I@nagios:server:automatic_starting:False' service.stop nagios3
then start Nagios where the VIP is running.
# salt -G "ipv4:$vip" service.start nagios3
Stacklight Dashboards
In this model, the Dashboard are reverse proxied by our Salt Master, so you can access them below
Kibana / https://172.16.10.100:5601 or http://172.16.10.253:5601/
Grafana / https://172.16.10.100:8084/login or http://172.16.10.253:3000/login l: admin p: password
Nagios / https://172.16.10.100:8001 or http://172.16.10.253 l: nagiosadmin p:nagios
Salt Tips & Tricks
After editing your model its a good practice to check it, just run
# reclass-salt --top
Sometimes you can get lost in all the interpolation that Reclass is doing on your classes. To check Pillar or Top data of a node, you can use
# reclass-salt --pillar prx01.int.cloudvps.com
If you want to know what are the state associated with a node
# salt 'prx01*' state.show_top
To look into a specific state
# salt 'ctl01*' state.show_sls nova
Refresh Pillar and sync_all
# salt '*' saltutil.refresh_pillar && salt '*' saltutil.sync_all
Salt troubleshooting
Salt can be run in debug mode with
cfg01# salt-call state.sls linux -l info or -l debug
You can look at currently running jobs
# salt 'ctl01*' saltutil.runner jobs.list_jobs
And kill a specific one
# salt 'ctl01*' saltutil.kill_job 20161208213122517028
Pulling formulas
While developing formulas, we aren’t packaging, it’s possible to provision them from their respective git repositories. If you’ve done so, you can later update all of them with the following trick
# cd /usr/share/salt-formulas/env
# for dir in $(find . -name ".git"); do cd ${dir%/*}; git pull ; cd -; done
Merge your model with upstream
If you want to merge your fork with upstream, start by configuring Git
# git config --global user.email "youname@yourdomain"
# git config user.name "yourname"
Add the corresponding upstream repository to your fork
# cd /srv/salt/reclass
# git remote add upstream https://github.com/Mirantis/mk-lab-salt-model.git
Fetch it
# git fetch upstream
Check out your fork’s local master branch and merge it
# git checkout master
# git merge upstream/master
You now have to resolve potential conflicts as usual, by removing the problematic sections which conflicts and commit to your repo. Consult Github documentation for further details.
Conclusion
I hope this cheatsheet is usefull. I’ll update it regularly to keep it relevant with the current Mk22 advanced model.
Links
- Syncing a forked repository