Infrastructure as a Service environment generates lots of logs, and by their distributed nature can stay up and running even if some components fails. OpenStack Architects have a difficult question to address, what’s the best tooling around an OpenStack cloud to troubleshoot and monitor it. Mirantis have been working for quite some time on a Fuel Plugins which leverage Elasticsearch, Kibana, InfluxDB, Grafana and Heka. This article shows how to install the plugins, how to deploy an environment with it and the value it brings to an OpenStack cloud. Lets get started.
About components
Before we dive in, If you don’t know the following Open Source components, take your time to investigate a bit :
- Elasticsearch - full-text search engine built on top of Apache LuceneTM
- Kibana - browser based analytics and search dashboard for Elasticsearch.
- Grafana
- Heka - stream processing software system developed by Mozilla
Installation
Mirantis OpenStack 6.1 is now using RPM packaging for its Fuel Plugin (instead of fp ones). So you should start by downloading the corresponding packages from our Fuel Plugin Catalog (It should be posted here soon), copy them to your Fuel Master Node and install all of them like this
scp lma_collector-0.7-0.7.0-1.noarch.rpm root@:fuel_master_node_ip:/tmp
scp elasticsearch_kibana-0.7-0.7.0-1.noarch.rpm root@:fuel_master_node_ip:/tmp
scp influxdb_grafana-0.7-0.7.0-1.noarch.rpm root@:fuel_master_node_ip:/tmp
You can now connect to your master node to install the plugin
ssh root@fuel_master_node_ip
cd /tmp
fuel plugins --install ./lma_collector-0.7-0.7.0-1.noarch.rpm
fuel plugins --install ./elasticsearch_kibana-0.7-0.7.0-1.noarch.rpm
fuel plugins --install ./influxdb_grafana-0.7-0.7.0-1.noarch.rpm
You can check that all plugins were successfully installed.
fuel plugins --list

id | name                 | version | package_version
---|----------------------|---------|----------------
1  | lma_collector        | 0.7.0   | 2.0.0
2  | influxdb_grafana     | 0.7.0   | 2.0.0
3  | elasticsearch_kibana | 0.7.0   | 2.0.0
Deploy a new OpenStack which leverage LMA
It’s now time to deploy a new OpenStack environment. I wrote an article few weeks ago on that, so I’m not repeating myself. But the plugins require Mirantis OpenStack 6.1 so that’s the main difference with this article.
Connect to Fuel and create a new environment. You should see three new sections within the Settings tab added by your three plugins. You can selectively activate them but keep in mind that the LMA Collector is required, or you won’t have any insight to show on Grafana/Kibana dashboards.
Elasticsearch
So each compute node will have an LMA Collector deployed which will send logs and notifications to Elasticsearch for indexing, collect timeseries for InfluxDB. Start by activating its checkbox and give it an environment name.
Mirantis LMA Collector Plugin can deploy its own Elasticsearch server (Local node) or consume one already deployed in your infrastructure (Remote). It’s the same concept for InfluxDB, you can select Local node or Remote Server. Here we select a local ones, so we have to specify the nodename with a baseos role where the plugin will deploy Elasticsearch, same for InfluxDB. It could be the same or different nodes. For the sake of resource management, I’ll use the same node.
Consume LBaaS
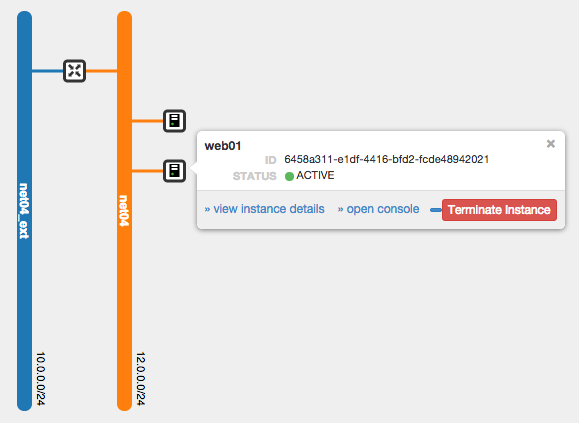
The deployer have created for you an internal network, the orange network below (CIDR 12.0.0.0/24), so lets deploy 2 instances on it, they will be used as web backend for our load balancer. You can use any linux distribution you want, I’m using Ubuntu 14.04 for web01 and web02 shown below.
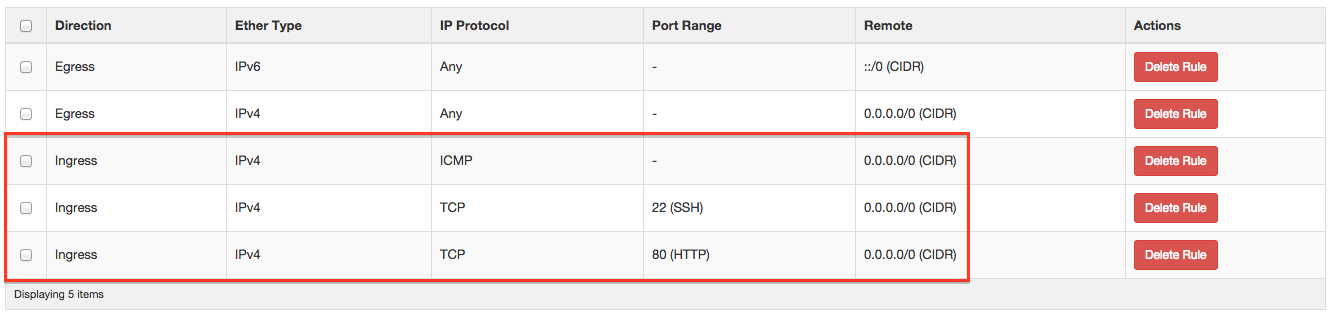
You need to setup a Security Group which allows at least SSH, ICMP and Web traffic to your Instances.
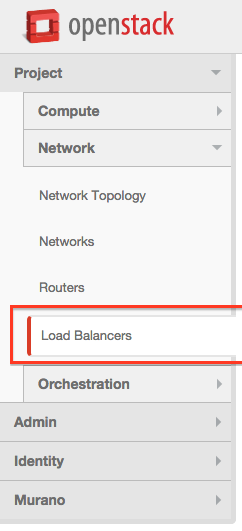
Click on Load Balancers
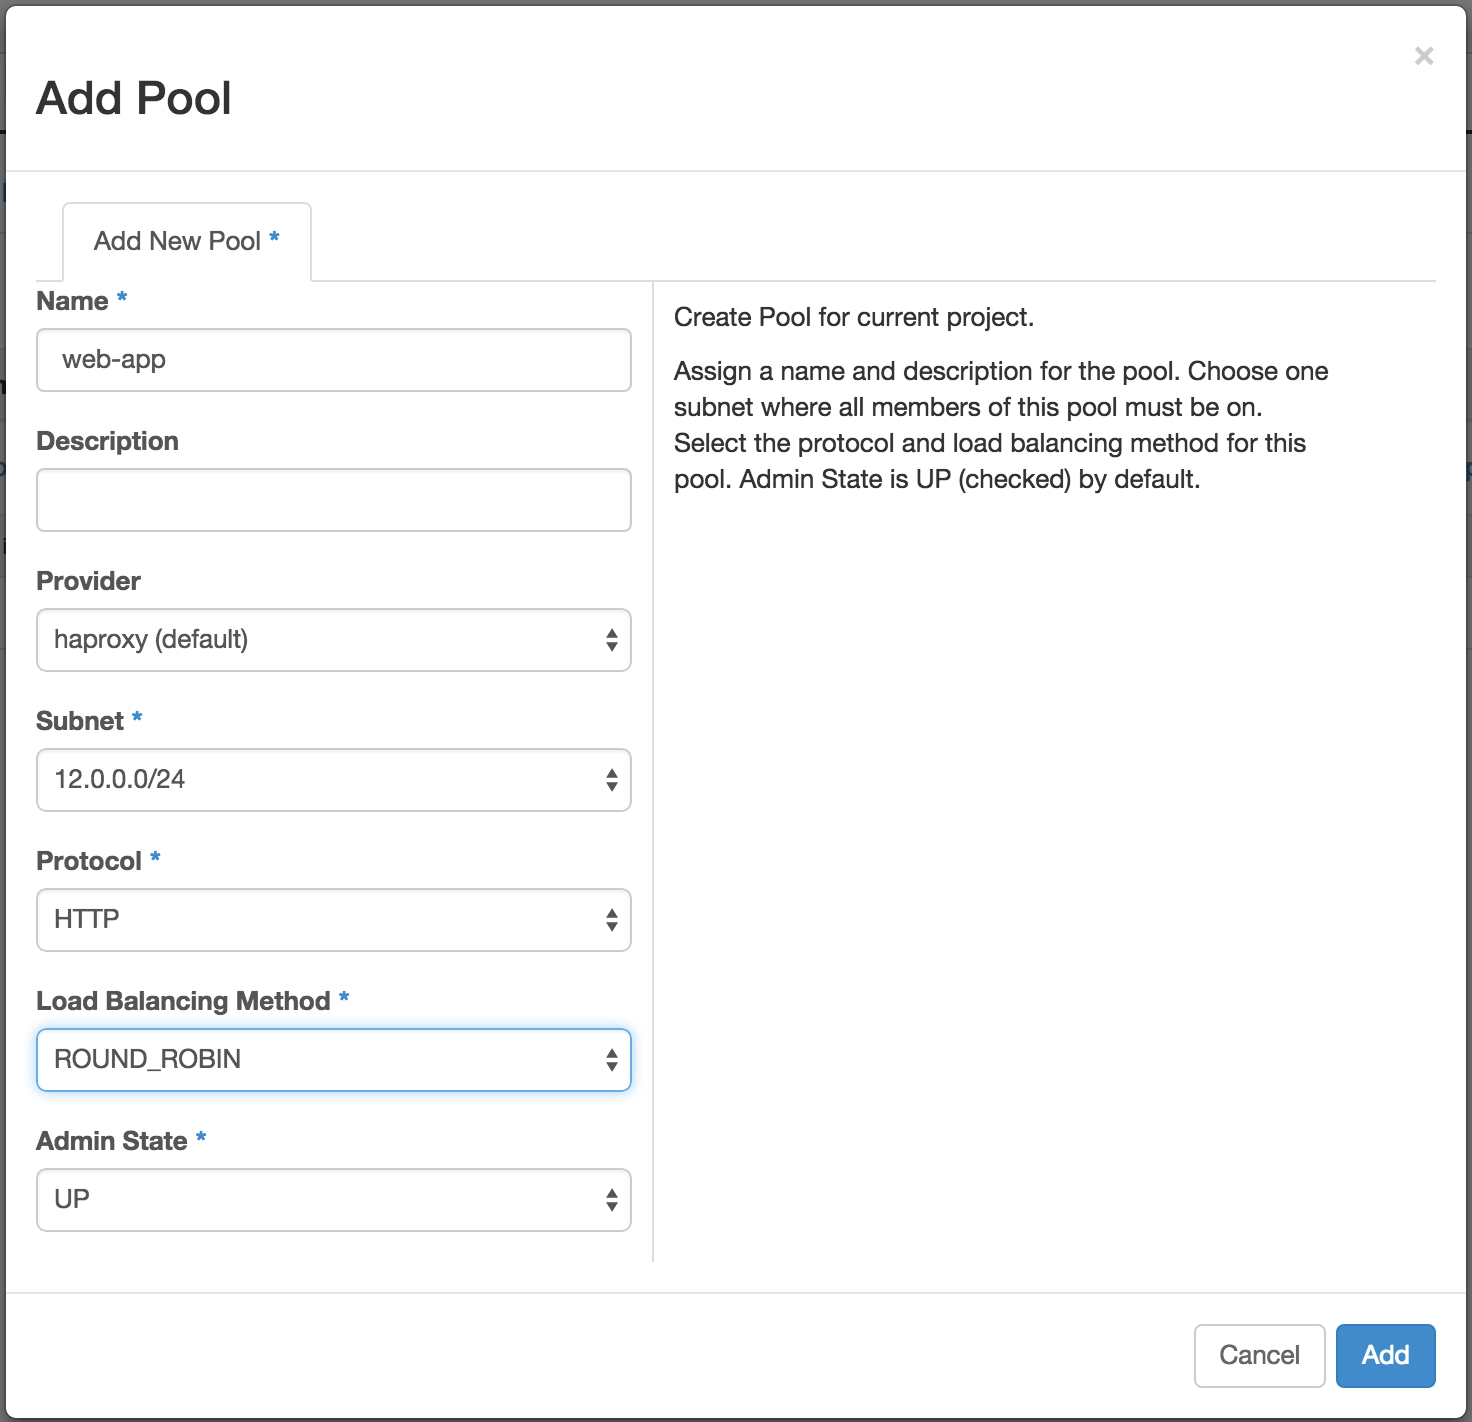
Create a LB Pool
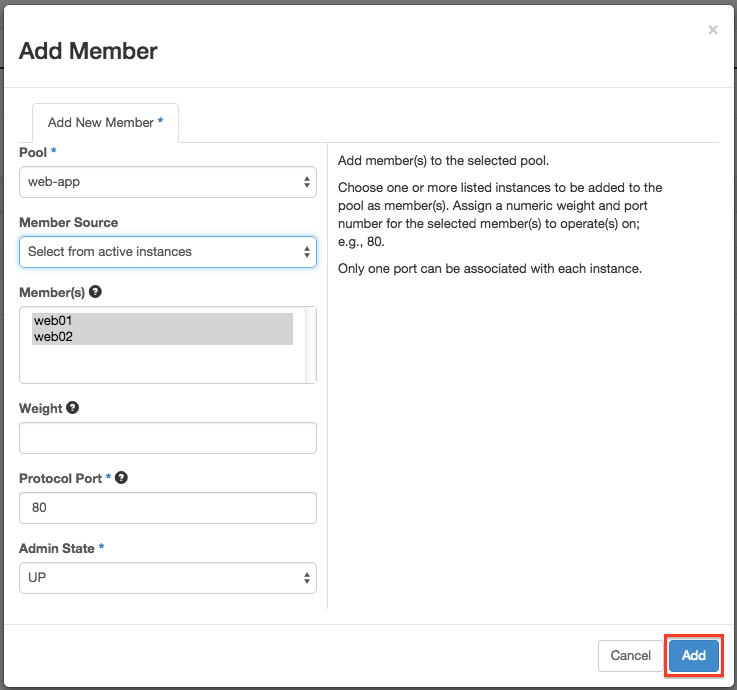
Add our web01 and web02 members
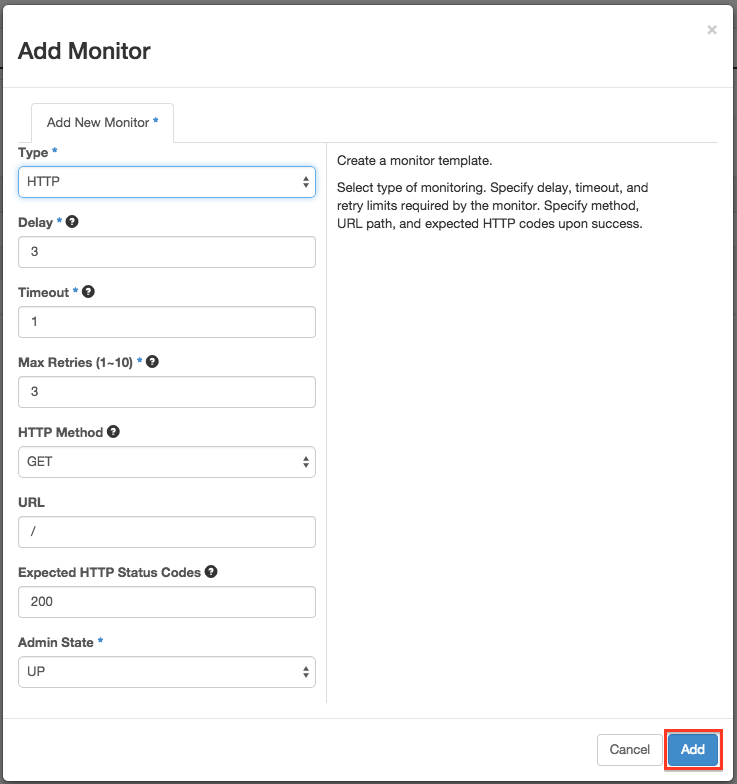
Add an HTTP Monitor
When I tried to associate a monitor to my Pool, I encountered a UI issue, the list of monitors were empty. So I used the CLI instead. First I gathered the ID of my Pool with
neutron lb-pool-list
We also need to get the ID of our HTTP Monitor
neutron lb-healthmonitor-list
We can now associate it with
neutron lb-healthmonitor-associate <MONITOR_ID> <POOL_ID>
If you want you can associate multiple monitors to your Pool.
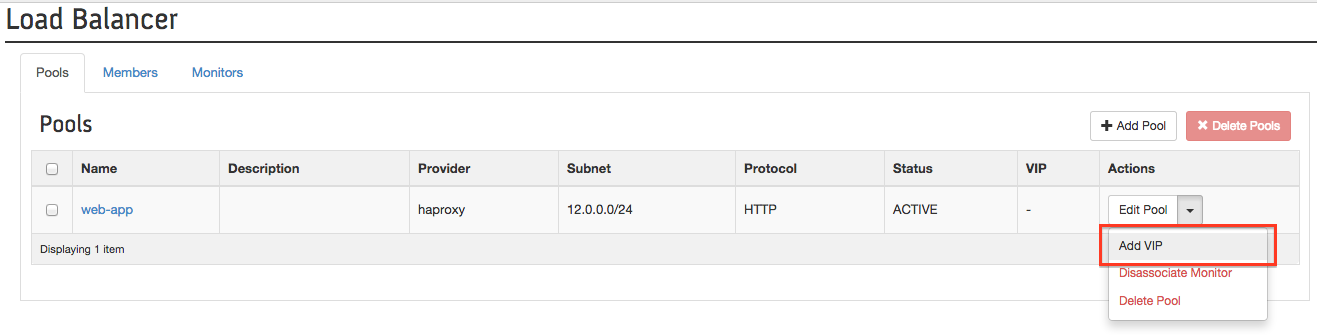
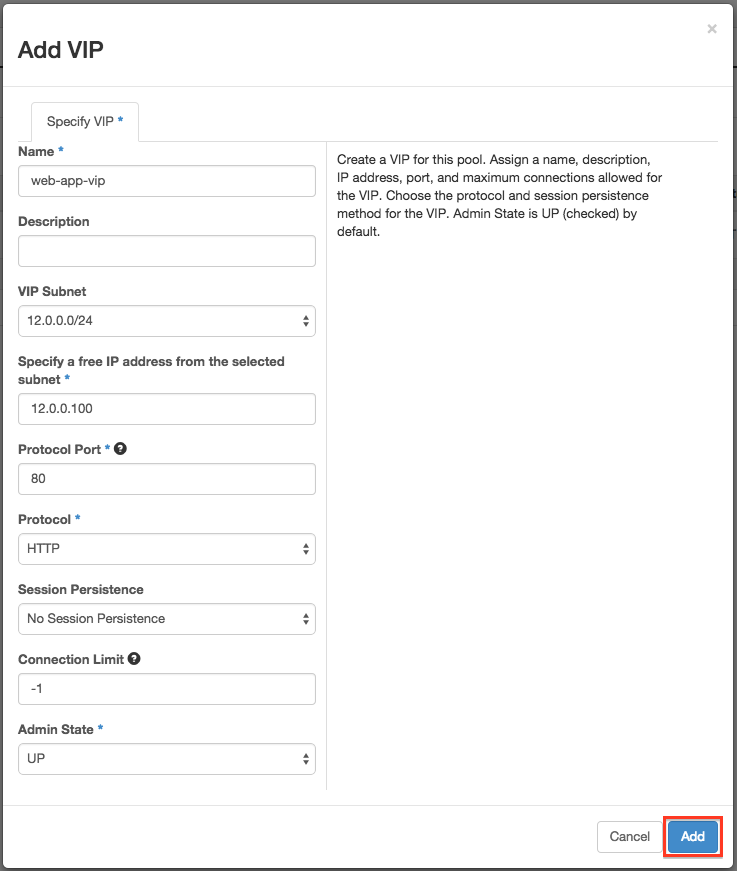
Last but not least, add a VIP to your Pool
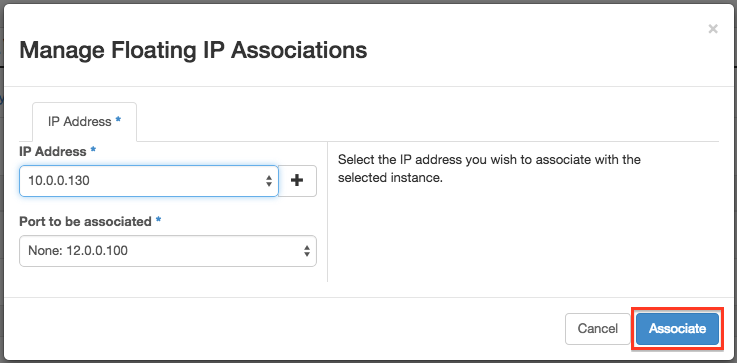
But that’s not the end of it yet, we need to associate a floating IP to our VIP which live inside the internal network. Reach the Compute > Access & Security Menu and click on the Floating IP tab. Allocate at least one IP to your project and associate it with your VIP.
The LBaaS configuration is now done, in the next section we’ll be using a trick to quickly setup something to listen on Port 80 on both of our VMs.
Web Instances
We started this exercice by deploying two Ubuntu instances, but neither of them are listening on port 80 for our test. So SSH to them and launch the following command (replace X by 1 or 2) :
ssh -l ubuntu <INSTANCE_FLOATING_IP>
echo "You've reach WEB0-X" > ./index.html
sudo python -m SimpleHTTPServer 80
Note: If you can reach any of them, you maybe forgot one of the following
- assign a floating IP to each instance
- associate a Security Group which allows SSH.
- use a public key for which you have the private key on your client machine
Final test
To check that everything works as expected, try to access VIP Floating IP (10.0.0.130) from your browser, you should see
You've reach WEB01
or
You've reach WEB01
You can reload the page, it should alternate if you choosed the round robin algorithm without any stickyness. You can also kill any of the two Python command to see HAProxy managing to put the instance out of the Pool and stick to the living one.
LBaaS Architecture
You have to take note that your Load Balancer is one armed, its connected to one subnet with one interface, and so will SRC NAT the Client IP Address. If you need to get the client IP address, you can get it from the X-Forwarded-For Header information.
Your tenant Load Balancer lives within a Linux namespace, it is being scheduled on the Neutron node by the LBaaS agent, and will create a qlbaas-* namespace. To investigate the namespaces use the following workflow
ip netns
identify the qlbaas-* namespace you need to investigate and run commands within that namespace using
ip netns exec qlbaas-XXXXXXXXXXXX ip a
You can check the current status of your LBaaS agent like this
service neutron-lbaas-agent status
HAProxy Supported Features
LB Algorithms
- Round robin
- Least connections
- Source IP
Monitors
- TCP (just a SYN test)
- HTTP (check status code)
- HTTPS (check status code)
Session persistence algorithms with HAproxy backend configuration in parenthesis
- SOURCE_IP (stick-table type ip size 10k)
- HTTP_COOKIE (injected by HAproxy -> cookie SRV insert indirect nocache / stick on src)
- APP_COOKIE (injected by you application, 56 caracters retained -> appsession
len 56 timeout 3h)
LBaaS Configuration
Lets now look at the backend configuration that allows Neutron to drive HAProxy as a Service.
LBaaS agent configuration lives within /etc/neutron/lbaas_agent.ini.
Interface Driver
The Fuel Plugin have added for us the following line to configure the LBaaS Interface Driver which is leveraging Open vSwitch
interface_driver=neutron.agent.linux.interface.OVSInterfaceDriver
Note for LinuxBridge it’s instead neutron.agent.linux.interface.BridgeInterfaceDriver
Device Driver
A Device Driver which provides the interface between the Neutron API and the programming of the load balancer is also required and configured in the same file like this
device_driver=neutron.services.loadbalancer.drivers.haproxy.namespace_driver.HaproxyNSDriver
OpenStack Dashboard
Horizon need to be informed to change its UI to add LB configuration capabilities. You have to enable LB in its /etc/openstack-dashboard/local_settings.py
'enable_lb': True
And restart the web server
service httpd restart
Service Plugin and Service Provider
Last but not least, Neutron must be configured to use a LBaaS Service Plugin in its config file /etc/neutron/neutron.conf
service_plugins =neutron.services.l3_router.l3_router_plugin.L3RouterPlugin,neutron.services.metering.metering_plugin.MeteringPlugin,lbaas
Now configure a Service Provider
service_provider=LOADBALANCER:Haproxy:neutron.services.loadbalancer.drivers.haproxy.plugin_driver.HaproxyOnHostPluginDriver:default
When you change its configuration file you need to restart Neutron Server
service neutron-server restart
Tenant LB configuration
Each tenant created Load Balancer configuration file reside within /var/lib/neutron/lbaas/LB_ID/conf/. The LB_ID can be found using ip netns on the neutron node where the agent scheduled the tenant LB or from the Horizon Dashboard.
CLI Management
We’ve done most of our operations using the Horizon Dashboard, but as you can imagine eveything could be done from the CLI. Here is a cheatsheet of all the commands available.
Pool
lb-pool-create --tenant-id <TENANT_ID> --description <DESCRIPTION> --lb-method <{ROUND_ROBIN, LEAST_CONNECTION, SOURCE_IP}> --name <NAME> -protocol <PROTO> --subnet-id <SUBNET>
lb-pool-delete <POOL>
lb-pool-list
lb-pool-show <POOL>
lb-pool-stats <POOL>
lb-pool-update <POOL> --description <DESCRIPTION> --lb-method {ROUND_ROBIN, LEAST_CONNECTION, SOURCE_IP}
lb-pool-list-on-agent <LBAAS_AGENT>
Most of the commands above are obvious, lets details the lb-pool-list-on-agent command which allows you to get the list of Pools associated with an agent. Each tenant LB will be scheduled to one of your agent, so knowing were it runs will help you troubleshoot the environment. LBAAS_AGENT is the ID or name of an LBaaS agent, you can get that information using neutron agent-list.
Member
lb-member-create --tenant-id <TENANT_ID> --admin-state-down -weight <WEIGHT> --address <IP> --protocol-port <PORT>
lb-member-delete <MEMBER>
lb-member-list --pool-id <POOL>
lb-member-show <MEMBER>
lb-member-update <MEMBER> --weight <WEIGHT> XXX CHECK JUNO CAPACIBILITY HERE MAYBE BETTER THAN JUST WEIGHT XXX
Health Monitor
lb-healthmonitor-create --tenant-id <TENANT_ID> --admin-state-down --expected-codes <EXPECTED> --http-method <HTTP_METHOD> --url-part <URL> --delay <DELAY> --max-retries <MAX> --timeout <TIMEOUT> --type <{PING, TCP, HTTP, HTTPS}>
lb-healthmonitor-delete <MONITOR>
lb-healthmonitor-associate <MONITOR> <POOL>
lb-healthmonitor-disassociate <MONITOR> <POOL>
lb-healthmonitor-list
lb-healthmonitor-show <MONITOR>
lb-healthmonitor-update <MONITOR>
VIP
lb-vip-create --tenant-id <TENANT_ID> --admin-state-down --address <IP> --connection-limit <LIMIT> --description <DESC> --name NAME --protocol-port <PORT> --protocol <{TCP, HTTP, HTTPS}> --subnet-id <SUBNET> <POOL>
lb-vip-delete <VIP>
lb-vip-list
lb-vip-show <VIP>
lb-vip-update <VIP> --connection-limit <LIMIT> --pool-id <POOL> --session-persistence type=dict type=<{HTTP_COOKIE, SOURCE_IP}>
lb-vip-update <VIP> --connection-limit <LIMIT> --pool-id <POOL> --session-persistence type=dict type=<APP_COOKIE,cookie_name=NAME>
Note: the only way to configure a session persistence from command line is to use the update CLI.
Putting everything together
Here is a session example that reproduce the configuration we’ve done earlier using Horizon Dashboard
neutron lb-pool-create --description "Web App" --lb-method ROUND_ROBIN --name web-pool --protocol HTTP --subnet-id <ID>
neutron lb-member-create --address 12.0.0.4 --protocol-port 80 web-pool
neutron lb-healthmonitor-create --delay 5 --max-retries 3 --timeout 16 --type HTTP XXX
neutron lb-healthmonitor-associate <MONITOR> <POOL>
neutron lb-vip-create --description "web app VIP" --name web-vip --protocol-port 80 --protocol HTTP --subnet-id ID web-pool
Logging
Logging information for your LBaaS agent can be found at /var/log/neutron/lbaas-agent.log
Conclusion
OpenStack LBaaS enable many new use cases and when you connect the dots with Heat (OpenStack orchestration), it becomes possible to deploy a 3-tier application entirely including the load balancer, great isn’t it. But it is still early days, to give you an idea of the current limitation of this solution:
- It’s not currently possible to create multiple virtual servers using the same IP Address and different Ports
- SSL Offloading is not supported
- Layer-7 LB not supported
But it’s a good starting point. I hope this article was usefull and that you’ve successfully deployed and configured LBaaS and had a little bit of fun in doing it.
Links
- LBaaS Wiki
- LBaaS Fuel Plugin documentation