Open vSwitch comes embedded with Linux Kernel 3.3 and up, it became the cornerstone of Network Virtualisation. But if you start having connectivity issues, it’s better to have a great bit of knowledge to really understand it. This article is a cheatsheet that will help you achieve this goal. I hope ;)
Open vSwitch features
To give you a rough idea of all the greatness of Open vSwitch (OVS), here is a brief feature list, as of version 2.3.
- IPv6 support
- Multiple tunneling protocols
- GRE
- VXLAN
- IPsec
- GRE and VXLAN over IPsec
- LISP (not yet upstream)
- GENEVE
- Kernel and user-space forwarding engine options
- Standard 802.1Q VLAN model with trunk and access ports
- NIC bonding
- LACP (IEEE 802.1AX-2008) on upstream switch (only static it seems)
- source-MAC load balancing
- active backup
- L4 hashing
- Visibility into inter-VM communication via NetFlow, sFlow(R), IPFIX, SPAN, RSPAN, and GRE-tunneled mirrors
- QoS (Quality of Service) configuration, plus policing
- BFD and 802.1ag link monitoring
- OpenFlow 1.0 plus numerous extensions
- Transactional configuration database with C and Python bindings
- High-performance forwarding using a Linux kernel module
- STP (IEEE 802.1D-1998)
- Support for HFSC qdisc
Open vSwitch Architecture
OVS is composed of three main components:
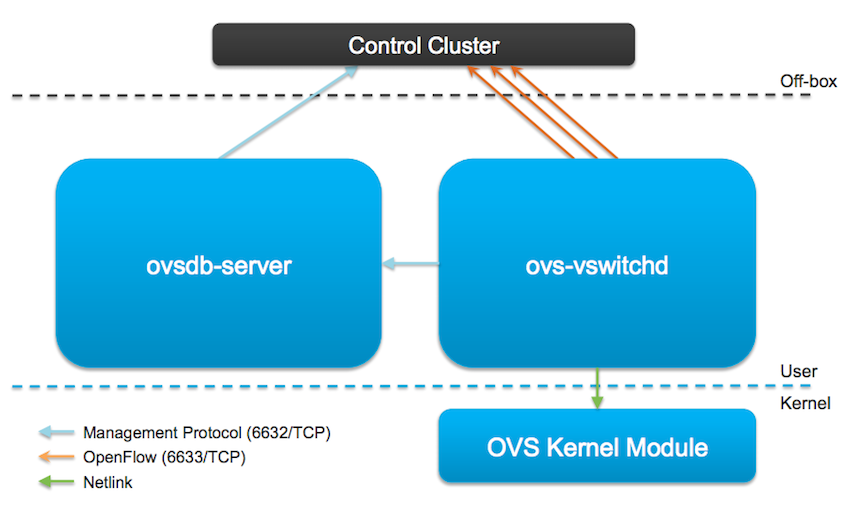
- ovs-vswitchd - Open vSwitch daemon (Slow Path)
- Forwarding Logic - learning, mirroring, VLANs, bonding.
- Remote Configuration and visibility
- ovsdb-server - Open vSwitch database server
- openvswitch_mod.ko - kernel module (Fast Path)
- Packet lookup, modification and forwarding
- Tunnel encap/decap.
Note: The Controller Cluster isn’t part of OVS.
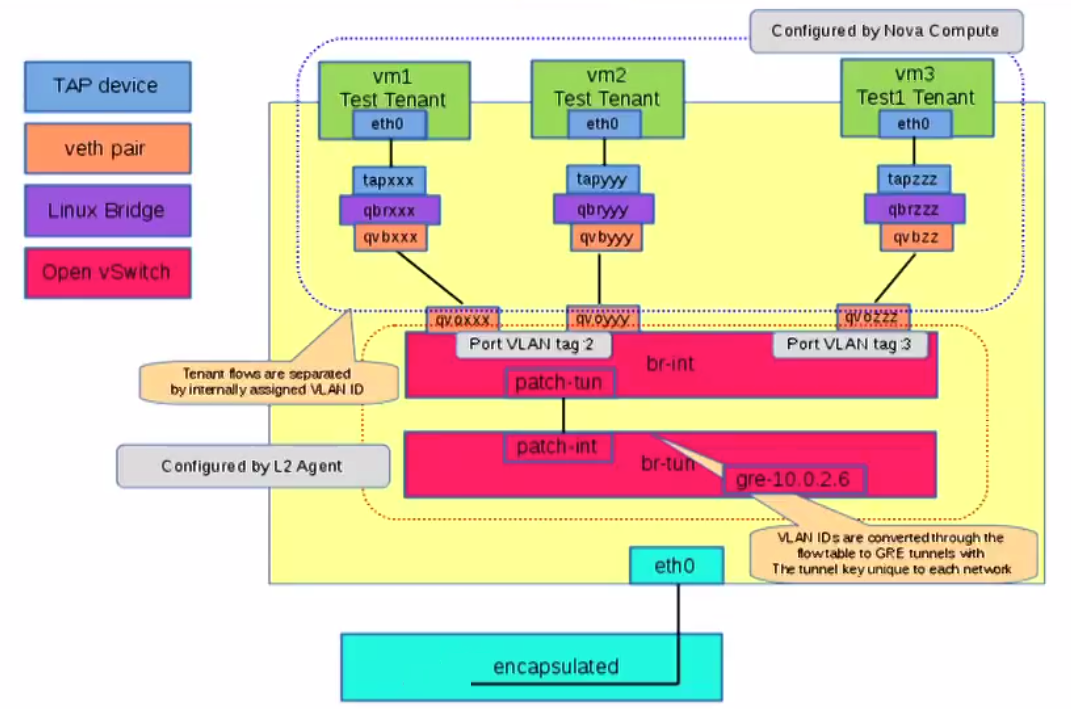
br-int, br-tun Bridges
Network virtualization, like NSX or OpenDaylight solutions brings a centralized controller cluster that leverage this switch. As a best practice, they separate the bridge that the VMs connect to (managed by the controller) vs. the bridges for everything else. Each OVS Bridge have by default a Port with the same name as the bridge itself. For example the Integration Bridge, where VMs are connected, is named br-int and contains a port called br-int. And the Bridge that will connect to the Transport Network on Hypervisor will be called br-tun with a port named br-tun.
For each packet a logical interface on br-int for Egress tunnel traffic and a Tunnel Endpoint will be determined. The packets forwarding is a host function and so will use the host routing table to find a way to get there. So the source IP address bound on the br-tun bridge is directly attached to a physical Nic, this is where the packet will Egress to the physical network. Sometimes br-tun is named br0 instead.
Open vSwitch CLI
Before goind any deeper with command line interface, you have to know that OVS does manage two kinds of flow:
- OpenFlows - User Space based
- Datapath - kernel based, a kind of cached version of the OpenFlow ones.
So different commands will be used to interact with each of them:
- ovs-ofctl - speak to OpenFlow module
- ovs-dpctl - speak to Kernel module
But lets start our cheatsheet with ovs-vsctl, an utility for querying and configuring ovs−vswitchd.
ovs-vsctl provides a high level interface for Open vSwitch Database. It allow you to query and configure ovs−vswitchd and is more convenient than ovsdb-* tools that are lower level commands.
ovs-vsctl –V version of openvswitch
ovs-vsctl show print a brief overview of database configuration
ovs-vsctl list-br list of configured bridges
ovs-vsctl list-ports <bridge> list of ports on a specific bridge
ovs-vsctl get-manager <bridge> list of NVP Controllers (TCP 6632)
ovs-vsctl get-controller <bridge> list of NVP Controllers (TCP 6633)
ovs-vsctl list manager list of NVP Controllers (TCP 6632)
ovs-vsctl list controller list of NVP Controllers (TCP 6633)
ovs-vsctl list interface list of interfaces
ovs-ofctl will allow you to monitor and administer OpenFlow switches.
ovs-ofctl dump-flows <br> Examine OpenFlow tables
ovs-ofctl show <br> port number to port name mapping
ovs-ofctl dump-ports <br> port statistics by port number
You can use watch like this
watch "ovs-ofctl dump-flows br-tun"
Note: read the man page of ovs-ofctl to better understand how to decode flow tables
ovs-appctl offer a way to send commands to a running Open vSwitch.
ovs-appctl bridge/dumpflows <br> examine flow tables, offers direct connectivity for VMs on the same hosts
ovs-appctl fdb/show <br> list mac/vlan pairs learned
ovs-dpctl can show, create, modify, and delete Open vSwitch datapaths.
ovs-dpctl dump-flows dump Datapath (kernel cached) flows
Open vSwitch and OpenStack Neutron
Since the introduction of Security Group rules after OpenStack Folsom, which filters egress/ingress VM traffic. It was necessary to add a Tap interface to connect the VM to instead of connecting the VM directly to the br-int because we couldn’t connect User Space program to another User Space program if we wanted IP Tables filtering. Tap interface offer a route to the kernel for filtering.
Neutron Flow Tables
The flows are divided in different tables.
table 0 all packets enter into this table
table 1 Packets coming from VM to Outside (Ingress)
table 2 Packets coming from outside Open vSwitch (tunnel) to VM (Egress) which need to go to a VM coming from VM are directed to 20 for Unicast and 21 for Multicast
table 3 not used
table 10 Inject a rule into table 20 to cause a return Path, so when VM repond to the Packet it will work.
table 20 does unicast packet
table 21 does broadcast packet
Open vSwitch Mirroring
Sometime it becomes quite usefull to mirror traffic for deeper analysis.
To do so, first create a virtual ethernet interface (veth)
ip link add type veth
ip link set veth0 up
Add it into the Open vSwitch bridge br-int
ovs-vsctl add-port br-int "veth0"
Create the mirror and mirror the packet from eth1, br-int, patch-tun:
ovs-vsctl -- set Bridge br-int mirrors=@m \
  --id=@veth0 get Port veth0 \
  --id=@eth1 get Port eth1 \
  --id=@patch-tun get Port patch-tun \
  --id=@br-int get Port br-int \
  --id=@m create Mirror name=veth select-src-port=@eth1,@patch-tun,@br-int \
  select-dst-port=@eth1,@patch-tun,@br-int output-port=@veth0
You can now tcpdump the veth0 interface to dump all mirrored traffic.
When finished delete the mirror
ovs-vsctl clear Bridge br-int mirrors
Neutron Troubleshooting process
At the Atlanta OpenStack summit, Phil Hopkins have done a great presentation, let me extract here his formal process for troubleshooting Neutron Networking.
- Gather Data
- Mac and IP of VMs, DHCP server, router
- Mac and IP of Data Network Node
- Set the neutron service to log a debug level
- Where the problem is located
- one tenant or all ?
- one network or all ?
- what protocols used ?
- is it a L2 or L3 problem
- Examine/locate
- look carefully at what is happening
- Isolate to tenant, network VM, compute or network node.
- Consider causes
- Need more data ?
- Consider solutions
- Test
- adjust only one thing at a time, put it back if it didn’t work
- Always keep a log of what you’ve done or you’ll get lost in the process !!!
- Repeat the process.
Neutron Debug command
neutron-debug is a great way to troubleshoot Neutron connectivity.
neutron-debug probe-clear clear all probes
neutron-debug probe-create create probe ports and interface, then plug it in.
neutron-debug probe-delete Delete probe, unplug and delete port
neutron-debug probe-exec Execute commands in the namespace of the probe
neutron-debug probe-list List probes
neutron-debug ping-all Ping all fixed_ips
Note: this section need some practical example !!!
Linux CLI
You’ll have to forget about ifconfig, netstat, route, arp soon, they are all deprecated and replaced with IProute2 package which brings ipcommand. So the new commands are:
basic networking
ip a - replace ifconfig
ip route - replace route
ip netns - network namespace
ip neighbor - replace ARP, also shows if a route is active. [goes stale after 60s by default]
udhcp -T 1 -A 1 - send a DHCP request on the wire
Below you’ll find an example of iptable with -v which shows the stats associated with a rule.
watch iptable -v
tcpdump
tcpdump -n -e -i <interface>
-e will show layer 2 communication
namespace
ip netns
ip netns exec <namespace> ip a
ip netns exec <namespace> tcpdump -e -n -l -i tap0ee66e73-48
-l will output packet on the fly, if you don’t use it, you will only see them when you interupt the command.
Packet Flow tracking example from VM/Compute node to Network Node.
on Compute node type:
ip a
Find the network interface that is pluged in the OVS, to dump the traffic like that
tcpdump -e -n -i <VM_VNIC_NAME>
Now dump the br-tun flows
watch "ovs-ofctl dump-flows br-tun"
In the output above, look closely at the n_packets values. If for example you don’t get a number increasing for resubmit(,2) flows, it means no packets are coming back from the tunnel. Remenber we said earlier that table 2 process packets coming from outside.
Still on the Compute node you can look at what’s happening on the physical interface
tcpdump -e -n -i <PHYSICAL_NIC_ON_TRANSPORT_NETWORK>
on the Network node tcpdump on physical interface
tcpdump -e -n -i <PHYSICAL_NIC_ON_TRANSPORT_NETWORK>
Dump the flows
watch "ovs-ofctl dump-flows br-tun"
Now enter corresponding namespace
ip netns
ip netns exec <NAMESPACE_ID> ip a
Grap the TAP interface of the namespace to tcpdump it
ip netns exec <NAMESPACE_ID> tcpdump -e -n -l -i <TAP_INTERFACE>
-l is required inside a namespace or you won’t see the packets dynamically flowing, everything will shown when you interupt the command which isn’t that great.
Check dnsmasq process is running
ps aux | grep dnsmasq
You can restart it with
restart neutron-dhcp-agent
Conclusion
I’ll make sure to update this article as soon as I find new tricks to troubleshooting the Open vSwitch/Neutron Environment. Stay tuned !
Links
- Phil Hopkins, Troubleshooting Neutron Networking
- Scott Lowe Article on how to setup LACP on OVS.